 Dose-Response Assessment
 Dose-Response Assessment
![]()
In order to determine the potential risk we face when exposed to toxicants the risk assessor must clarify the relationship between dose of a toxicant and the magnitude and type of biological response.
The Dose/Response for Non-Carcinogens
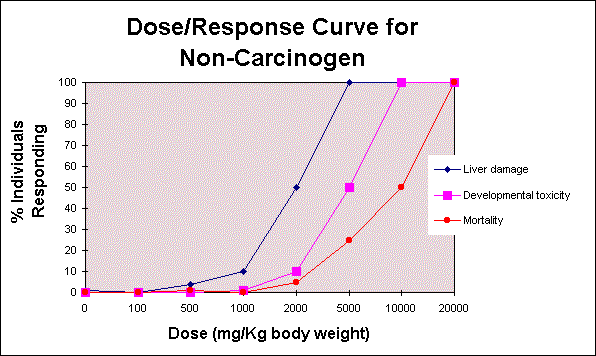
After gathering information from databases and scientific literature regarding the inherent toxicity (Hazard Identification) of a substance, an analysis of the relationship between the dose received and the respective response is conducted. The analysis will take the form of a Dose/Response Curve. Animal studies provide quite precise information about the adverse response to a substance because the studies are controlled in a lab. The results for a hypothetical non-carcinogenic agent are shown below.
Three endpoints are displayed: liver damage, developmental toxicity, and mortality. 'Endpoint' is defined as an effect observed in a toxicity study. These particular effects are selected because they are biologically significant and indicate a health concern. The 'most sensitive endpoint' for this substance is liver damage; liver damage occurs at 1000 mg/Kg body weight. As you can see, there is no sign of other types of toxicity at this dose. At a dose of 2000 mg/Kg all three effects are seen among the test animals. The LD50, lethal dose for 50% of the test population, occurs at a dose of 10,000 mg/Kg body weight (along the curve for mortality). This value is used to rank the acute toxicity of a substance among all other known substances. And at a dose of 100 mg/Kg there are No Observed Effects (NOEL) at any biologically significant endpoint.

The data for these curves may be obtained from a variety of studies. In this case the risk assessor would choose the study displaying the most sensitive species at the most sensitive endpoint. The NOEL for the most sensitive endpoint is termed the 'critical NOEL', which is used to determine safe exposure levels for humans. Sometimes the dose range in a study will not display a NOEL, but it may give a dose where there is a Lowest Observed Effects Level (LOEL). In this case the estimated NOEL is calculated by dividing the LOEL by an 'uncertainty factor' of 10.
Extrapolating to Humans
After determining the critical NOEL the dose is extrapolated to humans with the assumption that humans can be 10 times more sensitive than the most sensitive study species. In essence, this is another uncertainty factor (UF) applied toward interspecies variation. UF are applied to create a margin of safety. Uncertainty factors may also be applied if:
![]() The study
is weak
The study
is weak
![]() To account
for individual variation within the human population
(intraspecies variation)
To account
for individual variation within the human population
(intraspecies variation)
![]() To
extrapolate from an acute or subchronic dose range down to a
chronic toxicity dose
To
extrapolate from an acute or subchronic dose range down to a
chronic toxicity dose
Generally the total uncertainty factor does not exceed 1000. Application of the various UFs to the NOEL give us a reference dose (RfD), which is used to determine permissible exposure levels. See table 1 for a variety of chemical RfDs.
RfD = NOEL / UF
The 10 fold safety factor was introduced by Lehman and Fitzhugh of the Food and Drug Administration (FDA) in the 1950's. Its purpose was to protect the public from pesticide residues and food additives in food by creating a safety factor for an entire lifetime exposure to these types of substances. Lehman and Fitzhugh suggest that interspecies variation usually fell in the range of 2-3 fold and that sensitive individuals in a population did not vary more than approximately 1 order of magnitude from the average individual (1). The 10 fold safety factor is thought to be a 'conservative' judgment, meaning it is on the safe side.
Table 1. RfDs Published by
the Environmental Protection Agency for the
Chronic (Non-carcinogenic) Effects of Various Chemicals
| Chemical | Most Sensitive Organ or Effect |
RfD (mg/Kg/day) |
| Aldrin | Liver | 0.00003 |
| DDT | Liver | 0.0005 |
| Paraquat | Chronic Pneumonitis | 0.0045 |
| Fluoride | Objectionable dental fluorosis, cosmetic effects | 0.06 |
| Styrene | Red blood cell, liver | 0.2 |
| Ethylene Glycol | Kidney | 2 |
source: Elements of Toxicology and Chemical Risk Assessment. Revised Ed. July 1988. ENVIRON Corporation. Washington DC
Evidence of Carcinogenicity
The likelihood that a chemical is oncogenic to humans is based on evidence gathered during Hazard Identification. The following guidelines are used:
![]() Evidence in
humans from epidemiological studies
Evidence in
humans from epidemiological studies
![]() Evidence in
short term in
vitro tests
Evidence in
short term in
vitro tests
![]() Strength of
evidence from animal toxicity studies
Strength of
evidence from animal toxicity studies
![]() Type of
tumor and how many
Type of
tumor and how many
![]() Mechanism
of action
Mechanism
of action
Any chemical which shows signs of carcinogenicity are currently classified according to the strength of evidence by the USEPA. The National Toxicology Program Strength of Evidence Classification has a very clear system for chemical classification. This can be found on the front page of every volume of the NTP technical reports. The USEPA is in the process of changing its classification scheme. Both the old system and the new proposal are more obscure than the NTP Strength of Evidence Classification system. The EPA system can be applied in a more subjective fashion. The strength of evidence classification holds a lot of weight for characterizing the risk of getting cancer from exposure to a carcinogen.
Dose-Response Curve for Carcinogens
The approach to Dose/Response Assessment for carcinogens is different from non-carcinogens. For carcinogens there is no threshold whereby small doses elicit no response. It is assumed that carcinogens have an effect at any dose. This is because there may not be a practical threshold for an entire population exposed to more than one carcinogen. The assumption is based on the knowledge we have regarding the biological mechanism of cancer development. It only takes one molecule of a substance to genetically alter a cell, giving it the potential to develop into cancer. Cancer development is a multistage process that occurs over a period of years. It may take multiple exposures to a number of substances before a cancerous growth occurs. It is assumed that as the dosage of a carcinogen increases so does the risk or probability of getting cancer.
Mathematical models are used for characterizing the dose-response relationship. One of the advantages of these models is the ability of the model to extrapolate from the high doses in animal studies down to the low doses often experienced in human exposure scenarios. These models can be used to estimate very low risk values which are not possible with traditional animal studies. The models are built from the animal study data using statistical principles or general theories of carcinogenesis. The accuracy of the mathematical model is dependent upon how well it mimics the dynamics of the data. An accurate model cannot be made without enough good data.
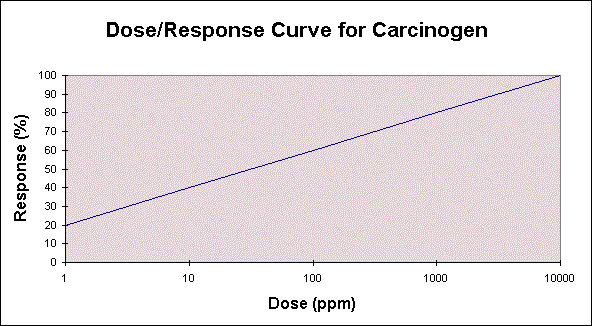
The dose/response curve for a carcinogen is linear because there is no threshold of response as is seen in the dose/response curve for non-carcinogens. A 1996 proposal outlines a new approach to dose-response assessment and risk characterization for carcinogenic chemicals exhibiting evidence of a threshold response. Important factors for developing the dose-response assessment for a carcinogen are potency, age, and interspecies differences. A dose/response curve for a hypothetical carcinogen looks like this:

The use of uncertainty factors for interspecies extrapolation are not applicable because the development of cancer occurs in the same fashion despite the species, individual, or dose, although genetic studies have shown that certain strains or genetic traits may predispose an individual to specific types of cancer. Extrapolation of the dose or potency from an animal study to a human is based on a body weight scaling factor.
The resultant curve displays carcinogen potency as the slope or grade of this line. See table 2 for relative potencies of various chemicals.
Table 2. EPA Identified
Cancer Risk Slope Factors (Potencies)
for Various Chemicals
| Chemical | Carcinogen Slope Factor (mg/Kg/day)-1 |
| Aldrin | 17 |
| Carbon tetrachloride | 0.13 |
| Chromium IV | 41 |
| Dimethyl nitrosamine | 51 |
| nickel refinery dust | 0.84 |
| Trichlorethylene | 0.11 |
source: Elements of Toxicology and Chemical Risk Assessment. Revised Ed. July 1988. ENVIRON Corporation. Washington DC., As reported in EPA's Integrated Risk Information System (IRIS) as of November 1987
Interesting Links and Related Topics:
Paper on the application of an additional uncertainty factor as a protective measure for children.(Acrobat reader necessary)
References:
1. Elements of Toxicology and Chemical Risk Assessment. Revised Ed. July 1988. ENVIRON Corporation. Washington DC. pp 51.
This page was prepared by Theresa L. Pedersen, UCD EXTOXNET FAQ Team. September, 1997. I would like to thank Nu-may Ruby Reed, PhD for allowing me to draw freely from her lectures on Health Risk Assessment, which are the backbone of this page. Her lectures were conducted at the University of California, Davis in the fall quarter of 1996. Thanks again Ruby!