To
all
of
our
readers over the last 29+ years, we would like to say thank
you for your interest and support of the Environmental Toxicology Newsletter.
This
issue
is
the last issue which will be edited by Art Craigmill and
Sandy Ogletree. Sandy retired from the University of California
(UC), Davis in April 1, 2010 and Art
retired July 1, 2010. Over the years it has been our privilege to offer
readers a variety of information tidbits and more in-depth articles
covering a wide variety of topics.
When we first started the newsletter back in 1980,
the internet was in gestation, and the newsletter was printed and
distributed by mail. At that time, UC had almost 500 Advisors and over
200 Specialists throughout the state. Almost thirty years later there
are less than 200 Advisors and 100 Specialists in the UC system, many
of whom are also reaching retirement age. As soon as the internet
matured we moved the newsletter to electronic delivery, which made it
possible to reach a larger number of people without additional cost. In
collaboration with colleagues at Michigan State University (Mike
Kamrin), Oregon State University (Jim Witt, Frank Dost, Terry Miller,
Jeff Jenkins and Dan Sudakin) and the University of Maryland (Berna
Magnuson) we extended our delivery of toxicology educational materials
using EXTOXNET (The Extension Toxicology Network). The EXTOXNET website
materials and copies of our newsletter are still available on EXTOXNET which is maintained by
colleagues at Oregon State University as part of the EPA National Pesticide Information Center.
While the times have changed, there are many
attitudes which have not, and which will probably continue to influence
society for many years. One of the hindrances to our society advancing
to new understandings is legislation which has been based on old
science. One example of US Legislation based on ancient science is the
Delaney Clause, based on our knowledge of cancer in the 1950’s. This
legislation basically banned the use of any food additive which was
shown to cause cancer in any animal. Our knowledge of the causes of
cancer and the mechanisms by which cells are transformed to become
cancerous has expanded enormously, yet the legislation remains deeply
rooted and is unlikely to change. There are people who are quick to
attack any changes which would lighten the regulatory burden on
chemicals which cause cancer by any mechanism, by saying that
any change would endanger the public and put us at greater risk. Since
it is impossible to prove a negative (that harm will never occur)
people tend to err on the side of extreme precaution, at least when it
comes to seemingly involuntary exposure to unfamiliar chemicals. When
it comes to familiar
chemicals and voluntary exposures, we tend to be more accepting. The
facts have not changed
over the last 30 years, based on actuarial statistics (body counts if
you will), the two most risky
chemical substances to humans are tobacco
and alcohol.
Over the years we have joked that analytical
chemists are responsible for most of the problems we toxicologists have
in communicating predictive risk to the public, because chemists can
detect
chemicals at minute concentrations at which we toxicologists cannot
measure biological effects or responses in whole animals. Sometimes
these very low concentrations can have effects in molecular assays and
cell cultures, and these results are extrapolated to whole animal
systems and predictive risk assessments done using these data. Some
type of predictive risk assessment has to be done,
and this is where the science is conjoined inextricably with public
policy, often resulting in confusing, chimeric regulations. Hopefully
we can
continue to progress in our knowledge of how chemicals effect all of us
and the environment, and make sound data-based decisions on how to
manage them.
During the last 10 or so years, Sandy has been
the main assembler of this newsletter, finding articles of interest and
putting them into the newsletter for me to review and edit, and then
doing the final formatting and posting of each issue to EXTOXNET. Her
persistence has been what has kept the newsletter in production for so
long, and she deserves oodles of kudos for all she has done. We have
worked together for almost 30 years, and during that time have also
become close friends. For me, it is one of the nicest things which has
happened during my tenure with UC.
Also during the almost 30 years that we have
worked together on this newsletter, we have had the opportunity to meet
and interact with many people within and outside the UC system. It has
been a great voyage of learning, discovery and fun. We thank all of you
for your companionship on this trip.
Your editors:
Art
and
Sandy
Current
Cigarette Smoking Among Adults Aged ≥18 Years - United States, 2009
Background: Cigarette smoking continues to be the
leading cause
of preventable morbidity and mortality in the United States, causing
approximately 443,000 premature deaths annually.
Methods: The 2009 National Health Interview Survey and the 2009
Behavioral Risk Factor Surveillance System were used to estimate
national and state adult smoking prevalence, respectively. Cigarette
smokers were defined as adults aged ≥18 years who reported having
smoked ≥100 cigarettes in their lifetime and now smoke every day or
some days.
Results: In 2009, 20.6% of U.S. adults aged ≥18 years were
current cigarette smokers. Men (23.5%) were more likely than women
(17.9%) to be current smokers. The prevalence of smoking was 31.1%
among persons below the federal poverty level. For adults aged ≥25
years, the prevalence of smoking was 28.5% among persons with less than
a high school diploma, compared with 5.6% among those with a graduate
degree. Regional differences were observed, with the West having the
lowest prevalence (16.4%) and higher prevalences being observed in the
South (21.8%) and Midwest (23.1%). From 2005 to 2009, the proportion of
U.S. adults who were current cigarette smokers did not change (20.9% in
2005 and 20.6% in 2009).
Conclusions: Previous declines in smoking prevalence in
the
United States have stalled during the past 5 years; the burden of
cigarette smoking continues to be high, especially in persons living
below the federal poverty level and with low educational attainment.
Sustained, adequately funded, comprehensive tobacco control programs
could reduce adult smoking.
To read the entire article go to:
MMWR
REF: Morbidity and
Mortality
Weekly Report, September 10, 2010 / 59(35);1135-1140.


Tobacco Use
Among Middle and High School Students - United States, 2000-2009
To monitor trends in tobacco use among middle and
high school students, CDC analyzed 2000-2009 data from the National
Youth Tobacco Survey (NYTS), a school-based survey that collects
information on tobacco use and related behaviors and attitudes from
middle school (grades 6-8) and high school (grades 9-12) students. This
analysis indicated that in 2009, 8.2% of middle school students and
23.9% of high school students reported current use of any tobacco
product; 5.2% of middle school students and 17.2% of high school
students reported current use of cigarettes. Overall prevalence did not
decrease from 2006 to 2009 for use of any tobacco product among either
group. During 2000-2009, the prevalence of current tobacco use among
middle school students declined (15.1% to 8.2%), as did current
cigarette use (11.0% to 5.2%) and cigarette smoking experimentation
(29.8% to 15.0%). Similar trends were observed for high school students
(current tobacco use: 34.5% to 23.9%; current cigarette use: 28.0% to
17.2%; cigarette smoking experimentation: 39.4% to 30.1%). Overall, no
change in susceptibility to initiate cigarette smoking was observed for
either group. To further decrease tobacco use and susceptibility to use
among youths, restrictions on advertising, promotion, and availability
of tobacco products to youths should be combined with full
implementation of evidence-based, communitywide, comprehensive tobacco
control policies.
Editorial Note: The findings in this report indicate that, from 2000 to
2009, prevalences of current tobacco and cigarette use and
experimentation with smoking cigarettes declined for middle school and
high school students, but no overall declines were noted for the
2006-2009 period. Declines were seen only for a few measures within a
few population subgroups. The general lack of significant change during
the shorter period indicates that the current rate of decline in
tobacco use is relatively slow. These findings are consistent with the
findings from the national Youth Risk Behavior Survey (YRBS) for recent
years. Although NYTS was not administered before 2000, YRBS results
indicate that the rate of decline in youth smoking was slower during
2003-2009 than during 1997-2003, and that these declines follow years
of increase in prevalence of youth cigarette use in the 1990s.
Cigarette use among high school students remains above the
Healthy
People 2010 target of ≤16% prevalence, and overall tobacco use
remains above the target of no more than 21% prevalence.
To read the entire article go to:
MMWR
REF: Morbidity and Mortality Weekly Report, August 27,
2010 /
59(33);1063-1068.
Nonsmokers'
Exposure to Secondhand Smoke - United States, 1999-2008
Background: Secondhand exposure to tobacco smoke causes heart
disease and lung cancer in nonsmoking adults and sudden infant death
syndrome, acute respiratory infections, middle ear disease, exacerbated
asthma, respiratory symptoms, and decreased lung function in children.
Methods: National Health and Nutrition Examination Survey
data from 1999-2008 were analyzed to determine the proportion of the
nonsmoking population with serum cotinine (the primary nicotine
metabolite) levels ≥0.05 ng/mL, by age, sex, race/ethnicity, household
income level, and to determine whether the household included a person
who smoked inside the home.
Results: During 2007-2008, approximately 88 million
nonsmokers aged ≥3 years in the United States were exposed to
secondhand smoke. The prevalence of serum cotinine levels ≥0.05 ng/mL
in the nonsmoking population declined significantly from 52.5% (95% CI
= 47.1%-57.9%) during 1999-2000 to 40.1% (95% CI = 35.0%-45.3%)
during 2007-2008. The decline was significant for each sex, age,
race/ethnicity, and income group studied except non-Hispanic whites.
The change was greatest from 1999-2000 to 2001-2002. For
every period
throughout the study, prevalence was highest among males, non-Hispanic
blacks, children (aged 3-11 years) and youths (aged 12-19 years), and
those in households below the federal poverty level.
Conclusions: Secondhand smoke exposure has declined in the
United States, but 88 million nonsmokers aged ≥3 years are still
exposed, progress in reducing exposure has slowed, and disparities in
exposure persist, with children being among the most exposed. Nearly
all nonsmokers who live with someone who smokes inside their home are
exposed to secondhand smoke.
To read the entire article go to:
MMWR
REF: Morbidity and Mortality Weekly Report, September 10,
2010 /
59(35);1141-1146.
Pesticide Data Program (PDP)
Annual Summary, 2008
Executive Summary
Results: During 2008, PDP tested 13,381 fresh and processed fruit and
vegetables, almonds, honey, catsh, corn grain, rice, groundwater, and
treated and untreated drinking water for various insecticides,
herbicides, fungicides, and growth regulators. Of the 13,381 total
samples collected and analyzed, 10,382 were fresh and processed fruit
and vegetables, including: apple juice, asparagus, cultivated
blueberries (fresh/frozen), broccoli, canned kidney beans, celery,
grape juice, green beans, green onions, greens (collard/kale),
nectarines, peaches, potatoes, spinach, strawberries, summer squash,
sweet corn (fresh on-the-cob/frozen), sweet potatoes, and tomatoes. PDP
also tested 186 almond, 558 honey, 552 catsh, 650 corn grain, 184
rice, 250 groundwater, and 619 treated (finished) and untreated
drinking
water samples.
For fresh and processed fruit and vegetables, almonds, honey, catsh,
and rice, approximately 76.4% of all samples tested were from U.S.
sources, 19.8% were imports, 2.7% were of mixed national origin, and
1.1% were of unknown origin. Approximately 20% of the apple juice
samples and 29% of the honey samples were of mixed national origin.
Corn grain, groundwater, and treated and untreated drinking water were
all from U.S. sources. Of the 11,960 samples of fresh and processed
fruit and vegetables, almonds, honey, corn grain, and rice samples
analyzed, the overall percentage of total residue detections was 1.6%.
The percent of total residue detections is obtained by comparing the
total number of residues detected and the total number of analyses
performed for each commodity. The percentage of total residue
detections for fresh fruit and vegetables ranged from 0 to 3.3%, with a
mean of 1.9%. The percentage of total residue detections for processed
fruit and vegetables ranged from 0 to 2.2%, with a mean of 0.6%. The
percentage of total residue detections for almonds was 1.4%, for honey
was 0.4%, for corn grain was 0.7%, and for rice was 0.7%.
For samples containing residues, the vast majority of the detections
were well below established tolerances and/or action levels. Before
allowing the use of a pesticide on food crops, EPA sets a tolerance, or
maximum residue limit, which is the amount of pesticide residue allowed
to remain in or on each treated food commodity. Established tolerances
are listed in the Code of Federal Regulations, Title 40, Part 180. In
setting the tolerance, EPA must make a safety finding that the
pesticide can be used with “reasonable certainty of no harm” and that
residues at (or below) the tolerance are safe. The reporting of
residues present at levels below the established tolerance serves to
ensure and verify the safety of the Nation’s food supply.
Excluding catsh, groundwater, and treated and untreated drinking
water, 30% of all samples tested contained no detectable pesticides
[parent compound and metabolite(s) combined], 24% contained 1
pesticide, and 46% contained more than 1 pesticide. Low levels of
environmental contaminants were detected in celery, collard and kale
greens, spinach, summer squash, and catsh at concentrations well below
levels that trigger regulatory actions. Residues exceeding the
tolerance were detected in 60 (0.5 %) of the 11,960 samples tested in
2008 – 58 samples contained one residue exceeding the established
tolerances and two samples contained two residues exceeding the
established tolerance. Residues with no established tolerance were
found in 442 (3.7 %) of the 11,960 samples (413 samples with 1 residue
each, 23 samples with 2 residues each, 4 samples with 3 residues each,
and 2 samples with 4 residues each). In most cases, these residues were
detected at very low levels and some residues may have resulted from
spray drift or crop rotations. For groundwater, 60 of the 136
collection sites (44%) contained low levels of detectable residues,
measured in parts per trillion. Forty-four different pesticide residues
(including metabolites) were detected in groundwater. In finished
drinking water, PDP detected low levels (measured in parts per
trillion) of some pesticides, primarily widely used herbicides and
their metabolites. Fifty-nine different residues were detected in the
nished drinking water and 63 residues were detected in the untreated
intake water. The majority of pesticides, metabolites, and isomers
included in the PDP testing profiles were not detected. None of the
detections in the nished water samples exceeded established EPA
Maximum Contaminant Levels (MCLs), Health Advisory (HA) levels, or
established Freshwater Aquatic Organism (FAO) criteria.
What Consumers Should Know:
The
purpose of PDP is to provide EPA with information about the level of
pesticides being indirectly consumed by the general public through
foods. This information is used to assist EPA in establishing and
reviewing the effectiveness of existing pesticide residue limits to
protect public health. PDP is required by law to focus on products
frequently consumed by infants and children.
PDP laboratory operations are designed to detect the smallest possible
levels of pesticide residues possible, even when those levels are well
below the safety margins established by EPA. It is important to note
that the mere presence of a pesticide
on food does not indicate the food is unsafe. In 2008, PDP
analyzed 11,960 samples of fresh and processed food commodities
(excluding catsh, groundwater, and treated and untreated drinking
water). Overall, the percentage of
residues detected (the number of residues detected divided by
the total number of analyses performed for each commodity) was 1.6%. More than 99% of the samples analyzed did not contain
residues above the safety limits (tolerances) established by EPA and 96.3 percent of the samples
analyzed did not contain residues for pesticides that had no tolerance
established.
Of all samples collected and analyzed in 2008, 67.5% were fresh fruits
and vegetables, many of which are often eaten in a fresh, raw state.
Health experts and the U.S. Food and Drug Administration agree washing
fresh
fruit and vegetables before eating is a healthful habit. Consumers can
reduce pesticide residues if they are present by washing fruit and
vegetables
with cool or lukewarm tap water.
To read the entire report go to:
Pesticide
Data
Program
REF: USDA
Agricultural
Marketing
Service Website.

California Pesticide Residues
in Fresh Produce Results from 2009
In 2009, the California Department of Pesticide Regulation (DPR)
collected 3,429 samples of more than 180 kinds of
commodities. All sampled commodities were derived from plants (no
animal products) and were raw (not processed). Sampling of processed
foods is the responsibility of the federal Food and Drug Administration
(FDA) and U.S. Department of Agriculture (USDA).
Samples were collected throughout the channels of trade, including
wholesale and retail outlets, distribution centers, and farmers
markets. Both domestic and imported produce were monitored. Of the
total samples, 57.4 % were domestic (1,969 of 3,429 samples), 41.6 %
were imported (1,426 of 3,429 samples), and 1.0 % were of undetermined
origin (34 of 3,429 samples).
All samples were tested in analytical laboratories using
multiresidue screens capable of detecting more than 200 pesticides and
breakdown products. The results:
- 73.4 % of samples had no pesticide residues detected (2,517 of
3,429 samples).
- 24.2 % of samples had residues that were within the legal
tolerance levels (831 of 3,429 samples).
- 2.4 % of samples had illegal residues (81 of 3,429 samples). A
produce item with an illegal residue level does not necessarily
indicate a health hazard.
Residues within tolerance were found in 24.2% of the samples (831 of
3,429 samples). As in recent years, the majority of these samples had
residues at less than 10 percent of the tolerance level. Illegal
residues were found in only 2.4 % of samples (81 of 3,429 samples). Of
these, 12.3% (10 of 81 illegal samples) had residues that were over the
tolerance level, and 87.7 % (71 of 81 illegal samples) had residues of
a pesticide not authorized for use on the commodity (no tolerance
established). Please note: Percentages may not add up to 100% due
to rounding.
In 2009, as in several recent years, certain commodities produced in
certain locations had a higher proportion of samples with illegal
residues:
| Commodity and
origin |
% of samples with illegal residues
(2008 and 2009 `combined) |
| Tomatillo produced in Mexico |
8.2 % (4 of 49 samples) |
| Taro root produced in China |
6.3 % (3 of 48 samples) |
| Chili peppers produced in Mexico |
4.4 % (10 of 226 samples) |
| Papayas produced in Mexico |
4.4 % (6 of 137 samples) |
| Snowpeas produced in Guatemala |
4.3 % (2 of 47 samples) |
| Limes produced in Mexico |
4.2 % (3 of 71 samples) |
| Bitter gourd produced in Mexico |
4.0 % (4 of 99 samples) |
| Ginger produced in China |
3.8% (6 of 160 samples) |
Although illegal, most of these residues were at very low levels (a
fraction of a part per million). Nonetheless, when illegal residues are
found, DPR reacts immediately by removing the illegal produce from
sale, then verifies that the produce is either destroyed or returned to
its source. In addition, if the owner of the produce has similar
produce from the same source, DPR quarantines that produce until the
laboratory verifies that it is free from illegal residues. Further, DPR
traces the distribution of the illegal produce by contacting
distributors throughout California, imposing additional quarantines and
conducting additional sampling as needed. In addition, DPR is actively
working with partners including the federal Food and Drug
Administration (FDA) and federal Immigration and Customs Enforcement
(ICE) to identify and eliminate sources of illegal residues.
We also collaborate with trade organizations and farmer-training
projects, encouraging them to educate producers about pesticide
residues in their commodities. For example, as a result of a series of
illegal residues in snow peas from Guatemala, DPR contacted the
Guatemalan exporters’ association and United Nations officials to share
our findings and request action. DPR’s 2009 monitoring indicates a
substantial reduction in the proportion of Guatemalan snowpeas with
illegal residues. Last year, the two-year combined data showed 21.7% of
Guatemalan snowpeas with illegal residues. This year, that has dropped
to only 4.3%. A portion of that decline was likely due to DPR’s
outreach.
Significance of the Results
The validity of any sampling program lies in its design and in its
ability to replicate the results. Over the past decade, even as the
number of samples varied, the findings have been consistent from year
to year. The majority of produce samples have no detectable pesticide
residues. Residues that are found are usually at levels that are
measured at a fraction of a part per million (ppm). In most years,
approximately one percent of total samples have residues over the
tolerance levels. Certain commodities produced in certain locations
have a history of higher proportions of illegal residues.
While the goal of DPR’s regulatory program is to ensure that all
food is in compliance with pesticide safety standards, a produce item
with an illegal residue level does not necessarily indicate a health
hazard. Each such incident, however, is evaluated for possible health
concerns. The results from years of DPR residue monitoring document the
overall safety of produce grown and consumed in California.
The data collected in 2009 are available for downloading on DPR’s
Web site www.cdpr.ca.gov. Click
on "A-Z
Index" and then go to "Residue Monitoring Program."
DPR is working to improve our
monitoring
In addition to the multiresidue screens that have been in use for
decades, DPR is preparing to add a newer analytical technique called
LCMS (liquid chromatography mass spectrometry). The advantage of LCMS
is that it can detect residues of recently-registered pesticides. These
newer pesticides have chemistries that are difficult to detect with the
multiresidue screens.
In August 2009, DPR began a pilot project to test the new LCMS
methodology. During 2009, we analyzed three commodities using LCMS:
leaf lettuce, oranges, and table grapes. Those commodities were
selected because some of the newer pesticides are used to produce them.
So far, the pilot project has been very successful, as shown by the
high detection rates with the LCMS screen:
| SAMPLES
WITH
DETECTABLE
RESIDUES |
| |
Screen used to detect
residues |
“Old” multiresidue screens
(averages from 2007 and 2008) |
“New” LCMS screen
(2009 only) |
| Leaf lettuce |
57.3% (176 of 307 samples) |
55.6% (60 of 108 samples) |
| Oranges |
34.4% (121 of 352 samples) |
86.0% (43 of 50 samples) |
| Table grapes |
29.3% (53 of 181 samples) |
80.6% (29 of 36 samples) |
Indeed, the LCMS screen successfully detected one low-level illegal
fungicide residue on a sample of leaf lettuce. That fungicide residue
would not have been detectable if we had used only the old multiresidue
screen. DPR contacted the distributor to ensure the lot of contaminated
lettuce was removed from sale. All other samples analyzed by LCMS
either had residues that were within legal tolerances, or had no
detectable residues.
The pilot project will continue with table grapes and additional
commodities in 2010. DPR looks forward to expanding our use of LCMS to
further strengthen our ability to detect the widest possible range of
pesticides.
REF: California
Department
of
Pesticide
Regulation Website.
Bedbugs
EPA's new bed bug web page provides information on chemical and
integrated pest management techniques for managing bed bugs, current
research efforts, links to educational materials developed by reputable
sources, and other information that will be helpful for the public
suffering from bed bugs and professionals on the front lines of this
battle. To visit the new page on bed bugs, go to
http://epa.gov/pesticides/controlling/bedbugs.html.
The
seriousness
of
bed
bug
problems
also
raises significant
environmental justice issues, which initially prompted EPA to convene
the first National Bed Bug Summit in April 2009. The Summit was very
well attended and provided a forum for open dialogue about solutions
for all stakeholders involved with bed bug issues. EPA continues to be
actively engaged with states, municipalities, and federal agencies that
are grappling with bed bug issues. The EPA is participating in various
inter-agency and regional workshops and symposia such as the National
Environmental Health Association's 2010 Annual Meeting and the National
Pest Management Association's Legislative Days. The Agency has also
initiated a new public health subgroup of the Pesticide Program
Dialogue Committee (PPDC) to focus on public health issues involving
pesticides. Through these various partnerships, the EPA hopes to find
improved solutions to the bed bug problem. (EPA OPP Update, 5/14/10).
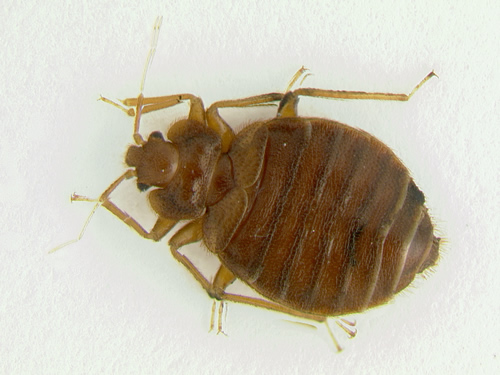
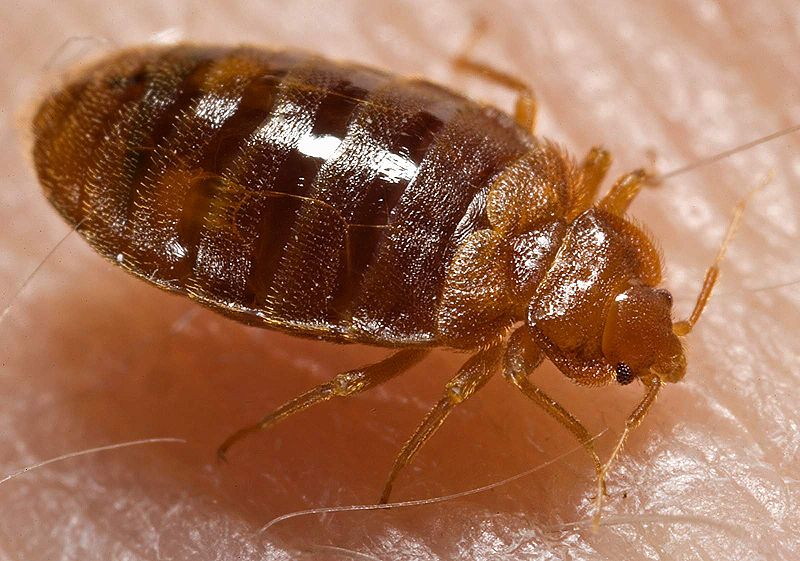
Adult Bedbugs
REF: Chemically Speaking, June 2010.
Insect
Repellents
The EPA has recently updated its insect repellent Web page
(
http://www.epa.gov/repellentfinder).
By
reading and following label
directions, the use of repellents can reduce or eliminate the
discomfort of insect bites. Ticks can transmit serious diseases such as
Lyme disease, Rocky Mountain spotted fever, and other serious diseases.
Repellents also curtail the spread of such mosquito-borne diseases as
St. Louis encephalitis and West Nile virus. The web page serves as a
one-stop-shop for information on registered repellents. It provides
up-to-date listings of mosquito and tick repellents as well as tips for
choosing the right product. One of the key features of the revamped
site is easy access to information about protection time. It will help
people choose the right product for the length of time they will be
outdoors. (EPA, 5/18/10).
REF: Chemically Speaking, June 2010.
End
of
Endosulfan
The EPA is taking action to end all uses of endosulfan in the United
States. Endosulfan, which is used on vegetables, fruits, and cotton,
can pose unacceptable neurological and reproductive risks to farm
workers and wildlife and can persist in the environment. The
organochlorine insecticide was first registered in the 1950s.
New data generated in response to the agency’s 2002 decision have shown
that risks faced by workers are greater than previously estimated. The
Agency also found that there are risks above the agency’s level of
concern to aquatic and terrestrial wildlife, as well as to birds and
mammals that consume aquatic prey which have ingested endosulfan. Farm
workers can be exposed to endosulfan through inhalation and contact
with the skin. However, endosulfan is used on a very small percentage
of the U.S. food supply and does not present a risk to human health
from dietary exposure.
The registrant of the insecticide/miticide is in discussions with EPA
to voluntarily terminate all
endosulfan uses. EPA is currently working out the details of the
decision that will eliminate all endosulfan uses, while incorporating
consideration of the needs for growers to timely move to lower-risk
pest control practices. (EPA OPP Update, 6/9/10).
REF: Chemically Speaking, July 2010.
New
Labeling
for
Foggers
The Environmental Protection Agency (EPA) is taking action to improve
residential safety and reduce
risks associated with “bug bombs,” or total release foggers (TRFs). The
Agency is calling for significant changes to their labeling to address
the most common causes of exposure incidents associated with TRFs.
Manufacturers must make a number of labeling changes by September 30,
2011.
Since the largest proportion of incidents is attributable to failure to
follow label instructions, the changes are targeted at minimizing those
incidents. To draw attention to critical information, future bug bomb
labels must be written in plain language with clear headings. To
further enhance clarity and risk understanding, the new labels will
also incorporate pictograms, which can be more effective than text in
communicating certain information, including explosion hazards and the
amount of time that a residence must be vacated after releasing the
fogger. The changes also strengthen instructions to vacate upon use and
air out upon return by requiring greater label prominence. A new
provision is that door hang-tags must be provided to inform others to
stay out of treated areas. In addition to these labeling improvements,
EPA is continuing to work with registrants on developing non-labeling
improvements, including transitioning to smaller foggers, time-delayed
release, and nonflammable propellants.
The number of foggers used is estimated at roughly 50 million units per
year. Although the available evidence suggests that bug bomb incidents
are infrequent relative to use of the devices, incidents of serious
injury have been reported. EPA's new bug bomb labeling improvements are
consistent with the recommendations of two 2008 state reports and are
intended to address concerns raised by the New York City Department of
Health. EPA will continue to monitor these products closely to ensure
that these new public health protections are effective and evaluate
whether additional actions are needed. (EPA, 3/24/10).
REF: Chemically Speaking, April 2010.
ADHD
Study
Draws
Media
Attention
A study published in Pediatrics in mid-May has garnered a high degree
of media attention and posed questions about organophosphate
insecticide exposure and attention-deficit/hyperactivity disorder
(ADHD). Data combed from a nutritional survey conducted between 2000
and 2004 predicted an elevated odds ratio of being placed into the ADHD
category when urinary phosphate metabolites where elevated when
compared to children with undetectable levels.
Several days later, the EPA released a statement that read: “The Agency
is taking this study very seriously and is incorporating its findings
in EPA's ongoing evaluation of the organophosphate pesticides, along
with additional health data." EPA has completed a comprehensive
reevaluation of all the organophosphate pesticides, and one of the
outcomes of this process was the elimination of nearly all residential
uses of organophosphate pesticides as well as some food uses to reduce
risks to children. Data used in the Pediatrics study, from 2000-2004,
would have been generated while these OP uses were being phased out
and, thus, would not have reflected the new restrictions imposed by EPA.
Overall, the Agency agrees with the authors' conclusion that [sic] the
data do not currently prove that organophosphates cause ADHD and that
there are limitations in the organophosphate exposure assessment
through the use of a single metabolite from a single spot urine sample.
To determine whether a causal relationship exists between pesticides,
including organophosphates, and health effects, the Agency is
collaborating with various agencies of the National Institutes of
Health and the Centers for Disease Control and Prevention in sponsoring
the National Children's Study (NCS), a prospective study of the sort
recommended by the authors.
EPA recommends that consumers who want to reduce their exposure to
pesticides use common sense pest control methods that remove sources of
food, water, and shelter for pests to reduce or eliminate pest problems
before turning to pesticides. “Always read and carefully follow label
directions before using any pesticide.”
The EPA has canceled 17 organophosphate (OP) pesticides since the
beginning of the reregistration process, leaving 32 currently
registered. Fifty-eight OP pesticide uses on foods commonly eaten by
children were canceled or are being phased out. As a result, OP
pesticide use on foods commonly consumed by children decreased from
approximately 28 million pounds of active ingredient to approximately
12 million pounds (a 57% reduction) between the mid-1990s and 2004. The
Registration Review schedule for the OP pesticides has also been
accelerated, with dockets opening in 2008 and 2009.
The statement released by the EPA is supported by residue analyses that
occur yearly while conducting the Pesticide Data Program. Results from
2008 (the latest data) Florida-grown strawberries reflect only the
presence of malathion in approximately ten percent of the strawberry
samples (n=82). The highest concentration detected was over 100 times
less than the tolerance (0.07 ppm versus 8 ppm). No other OP
insecticides were detected. On a national basis, 20 percent of samples
(n=741) contained malathion and methomyl. The detected concentrations
of those two OP insecticides were always below the tolerances for the
active ingredients. As methomyl is no longer employed in strawberry
production, those residues will also be absent from strawberries
presently and in the future. There were no other insecticides of any
type detected in the national sample. (Pediatrics - 5/17/10, EPA -
5/21/10, & USDA PDP, Dec. 2009).
REF: Chemically Speaking, June 2010.
Do Not
Eat "Ginger Candy" from China
Kevin Reilly, acting director of the California Department of Public
Health (CDPH), warned consumers not to eat “Ginger Candy” imported from
China after CDPH tests found it contained
more than twice the amount of lead that
California allows in candy products.
 The candy with the brand name
“Ginger Candy” contained as much as 0.25
parts per million (ppm) of lead. California considers candies with lead
levels in excess of 0.10 ppm to be contaminated. Pregnant women
and parents of children who may have consumed this candy should consult
their physician or health care provider to determine if medical testing
is needed. Although there have been no
illnesses reported from consumption of the candy, consumers
in
possession
of
“Ginger
Candy”
should discard immediately.
The candy with the brand name
“Ginger Candy” contained as much as 0.25
parts per million (ppm) of lead. California considers candies with lead
levels in excess of 0.10 ppm to be contaminated. Pregnant women
and parents of children who may have consumed this candy should consult
their physician or health care provider to determine if medical testing
is needed. Although there have been no
illnesses reported from consumption of the candy, consumers
in
possession
of
“Ginger
Candy”
should discard immediately.
“Ginger Candy” is manufactured by DaiJyoBu® in China, imported and distributed
by Anhing Corporation in Los Angeles. Anhing Corporation has initiated
a voluntary recall of the candy and is working with businesses to
ensure that the contaminated candies are removed from the market place.
“Ginger Candy” is sold in an 8 ½” x 6” plastic bag containing
six individually wrapped pieces of candy. There is a bright orange
border at the top of the package. Chinese characters and “Ginger Candy”
appear in the border. The bag is decorated with boxes that alternate
between clear and white with blue dots. The bottom of the package shows
a large yellow ginger root with green sprouts. There is a character of
a winking, black-haired boy on the right-hand side of the package. The
word “DaiJyoBu®” appears at the boy’s feet.
Consumers who find the brand name
“Ginger Candy” for sale are encouraged to call the CDPH Complaint
Hotline at 1-800-495-3232. For more information about lead poisoning,
contact your county childhood lead poisoning prevention program or
public health department. Additional
information
is
available
at
CDPH’s California
Childhood
Lead Poisoning Prevention Branch: Children at Risk page.
REF: CDPH website,
September
21,
2010.
Do Not Consume Two Brands of
Frozen Mamey Fruit Bars
Dr. Mark Horton, director of the California Department of Public
Health (CDPH), today warned consumers not to eat Fruiti Pops or Paletas
California brand frozen mamey fruit bars, also known as paletas,
because of potential contamination with Salmonella Typhi.
Mamey, which
is the main ingredient of these products, is a tropical fruit from
Central America.
There have been no illnesses reported from consumption of the frozen
mamey fruit bars. But the mamey used to produce the bars was from Goya,
Inc., a company that initiated a recall of its mamey pulp after
sampling detected Salmonella. The Goya brand mamey pulp was associated
with Salmonella Typhi illnesses. At least nine people in
California and
Nevada have been ill with typhoid fever, caused by Salmonella Typhi.
Typhoid fever is a life-threatening illness caused by the bacterium
Salmonella Typhi, which lives only in humans. Infection
results from
eating foods or drinking water or beverages that have been contaminated
by an infected person, or by direct or indirect contact with fecal
material from infected persons. Most cases in the U.S. are acquired
from recent travel to developing countries, but a small number of cases
may be acquired locally from rare carriers, people who recovered from
typhoid fever but continue to carry and shed the bacteria.
Symptoms of typhoid fever include fever, headache, abdominal pain, and
constipation or diarrhea. Most ill persons need to be hospitalized for
antibiotic treatment. Carriers usually do not have symptoms but, once
identified, also need antibiotic treatment.
People who develop symptoms of typhoid fever after consuming Fruiti
Pops and Paletas California brand frozen fruit pops should consult
their health care provider.
Fruiti Pops frozen fruit bars are 4 ounces and packaged in a clear
plastic wrapper. The frozen fruit bars do not contain lot numbers or
expiration dates. The Universal Product Code (UPC) of the recalled
product is 763734000097. The recalled fruit bars were distributed in
California, Arizona, and Texas through distributorships.
Paletas California frozen mamey fruit bars are 4 ounces and packaged in
plastic wrappers. The fruit bars are sold in a package of 24 paletas.
All production lot codes are being recalled. The UPC of the recalled
product is 3641800200. The recalled fruit bars in California were
distributed to retailers in Southern California.
Consumers in possession of these products are advised to dispose of
them. Consumers with questions may contact Fruiti Pops at (562)
404-2568 and Paletas California at Foods, Inc. at (562) 944-0680.
REF: CDPH
website, August 31, 2010.
How to Dispose of Unused
Medicines
Is your medicine cabinet filled with expired drugs or medications you
no longer use? How should you dispose of them?
Most drugs can be thrown in the household trash, but consumers
should take certain precautions before tossing them out, according to
the Food and Drug Administration (FDA). A few drugs should be flushed
down the toilet. And a growing number of community-based "take-back"
programs offer another safe
disposal alternative. To read this article link to: How
to
Dispose of Unused Medicines.
REF: FDA Consumer
Health
Information.
Home Gardens and Lead:
What You
Should Know about Growing Plants in Lead-Contaminated Soil
Lead is a heavy metal that occurs in all soils but can reach
hazardous levels in some soils as a result of leaded-fuel exhaust,
industrial wastes and other causes. Learn how to test your soil for
safety and see what you can do if lead levels run too high.
This University of California Agriculture and Natural Resources
publication is free and can be downloaded. Link to: Home Gardens and Lead
 Veterinary Notes
Human NSAIDs, Antidepressants Commonly
Poison Pets
The
Pet Poison Helpline
is warning about pet poisonings caused by
human medications. This 24-hour service is available throughout North
America for veterinary professionals and pet owners who need help
treating a potentially poisoned pet.
Tens of thousands of phone calls are fielded about human prescription
drugs, rat poisons and environmental/home poisons. Nearly half the
calls involve over-the-counter and prescription medications for humans.
The top 10 human medications most frequently ingested by pets are:
- Nonsteroidal
anti-inflammatory drugs (e.g. Advil, Aleve and Motrin).
- Acetaminophen (e.g.
Tylenol). One regular-strength tablet of acetaminophen can damage a
cat's red blood cells. In dogs, acetaminophen leads to liver
failure and, in large doses, red blood cell damage.
- Antidepressants.
(e.g. Effexor, Prozac, Lexapro). While these medications are
occasionally used in pets, overdoses can lead to serious neurological
problems such as sedation, incoordination, tremors and seizures. Pets,
especially cats, seem to enjoy the taste of Effexor and often eat the
entire pill. One pill can cause serious poisoning.
- ADD and ADHD
medications (e.g. Concerta, Ritalin). Minimal ingestion by pets
can cause life-threatening tremors, seizures, elevated body
temperatures and heart problems.
- Benzodiazepines and sleep
aids (e.g. Xanax, Ambien, Lunesta). About half the dogs that
ingest sleep aids become agitated instead of sedated. In addition, the
drugs may cause severe lethargy, incoordination and slowed breathing.
- Birth-control pills
(e.g. estrogen, estradiol, progesterone). Ingestion of large amounts of
estrogen and estradiol can cause bone marrow suppression, particularly
in birds. Additionally, intact female pets are at increased risk of
side effects from estrogen poisoning.
- ACE inhibitors (e.g.
Zestril, Altace). Pets ingesting small amounts may be monitored at home
pending signs of kidney failure or heart disease.
- Beta blockers (e.g.
Tenormin, Coreg). Overdoses can cause a life-threatening fall in blood
pressure and a slow heart rate.
- Thyroid hormones
(e.g. Armour desiccated thyroid, Synthroid). Large acute overdoses in
cats and dogs can cause muscle tremors, nervousness, panting, a rapid
heart rate and aggression.
- Cholesterol lowering agents
(e.g. Lipitor, Zocor, Crestor). Most statin ingestions cause mild
vomiting or diarrhea. Serious side effects come with long-term use.
The hotline is staffed by board-certified veterinary internal
medicine specialists, veterinary emergency critical care specialists,
veterinarians, technicians and pharmacologists.To reach the Pet Poison
Helpline call: 800-213-6680
REF: Veterinary Practice News, March 2010
The best of Veterinary Practice News annual competition, "They Ate
What?" is an xray contest to remind pet owners to be more careful about
what your pet may ingest.
http://media.animalnetwork.com/channelmedia/vpn/TheyAteWhat.pdf
THANKS
EVERYONE... It has been a wonderful roller coaster ride over the
years.... Here's to a few more trips around the sun...
Sandy
Click on the Pig!